The Least Auklet diet sample analysis has been completed by Chris Stark, and we now have the results in the form of data.
WHAT DO THE DATA LOOK LIKE?
Data are stored in cells in a worksheet using a computer program like excel. The worksheet looks like a grid, with many rows and columns. Usually, each grid cell holds a single item of data.
The diet data are arranged with each meal on one line of the grid. The below example shows the first 6 columns for 5 meal samples. Each meal has a specific code ID (First Column: island-species-year-sample number).
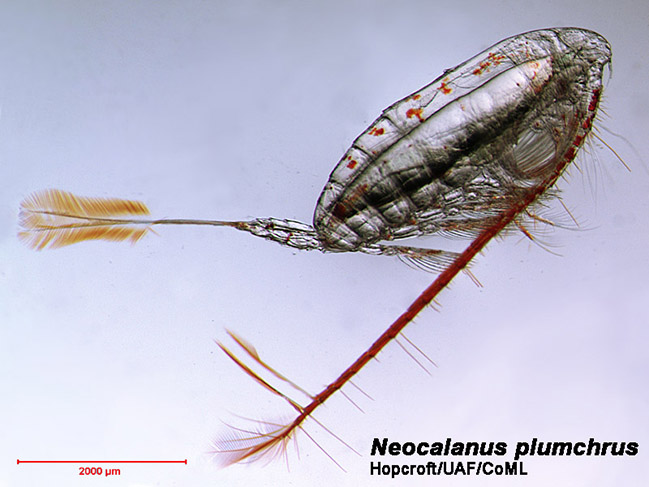
Each meal sample contains many hundreds of zooplankton, and these zooplankton are identified down to species (and in some cases age and sex). This information is interesting for seabird biologists because the energy content of zooplankton can differ with age and sex.
Our data were organized with one column for each zooplankton species. There were 45 different species categories (including different age/sex classes), so the data-base is too large to show here. The total number of each species category was recorded for each meal sample.
NOW WHAT?
Chris has sent the final data to biologists at the Alaska Maritime National Wildlife Refuge. http://www.fws.gov/alaska/nwr/akmar/ The datasheets can be attached to an email and easily sent that way.
Each year, the Refuge collects many types of data on many species of seabirds, and they need to keep their data very organized in order for them to be useful.
FORMATTING
The data will need to be formatted (how the data is arranged in a data-sheet) so that they match (and can therefore be easily summarized and compared) with data collected in previous years or from other locations.
PROOFING
The data will then need to be proofed (checked to see that no mistakes were made by the people entering and formatting the data).
DATA-BASE
The formatted, proofed data will be added to a computer data-base, and backed up to make sure there is more than one copy.
All this work takes time, and it may be several months until the data are ready for use (for example, biologists may be interested in comparing the diet of Pribilof birds with those of birds ten years ago). We look forward to learning how these data will be used in the future.
A QUICK PEEK AT THE DATA
Even though results may change slightly during proofing, many scientists can’t resist having a quick look at their data. It’s exciting to get a first glimpse of any large patterns the results may show, and this often helps provide the excitement needed to continue with the time-consuming job of data organization.
We took an initial look at the Least Auklet diet data, plotting a very simple summary pie chart to see what the most important groups of zooplankton were.
We found that:
- Calanus Copepods were the most important prey for Least Auklets on the Pribilof Islands in 2013.
- Least Auklets catch a lot of zooplankton. Our 35 samples (mostly incomplete meals) contained more than 40,000 individual zooplankton!
These birds were busy parents!
Pie-Chart showing preliminary diet data for the Least Auklets breeding on St. George and St. Paul during summer 2013.
