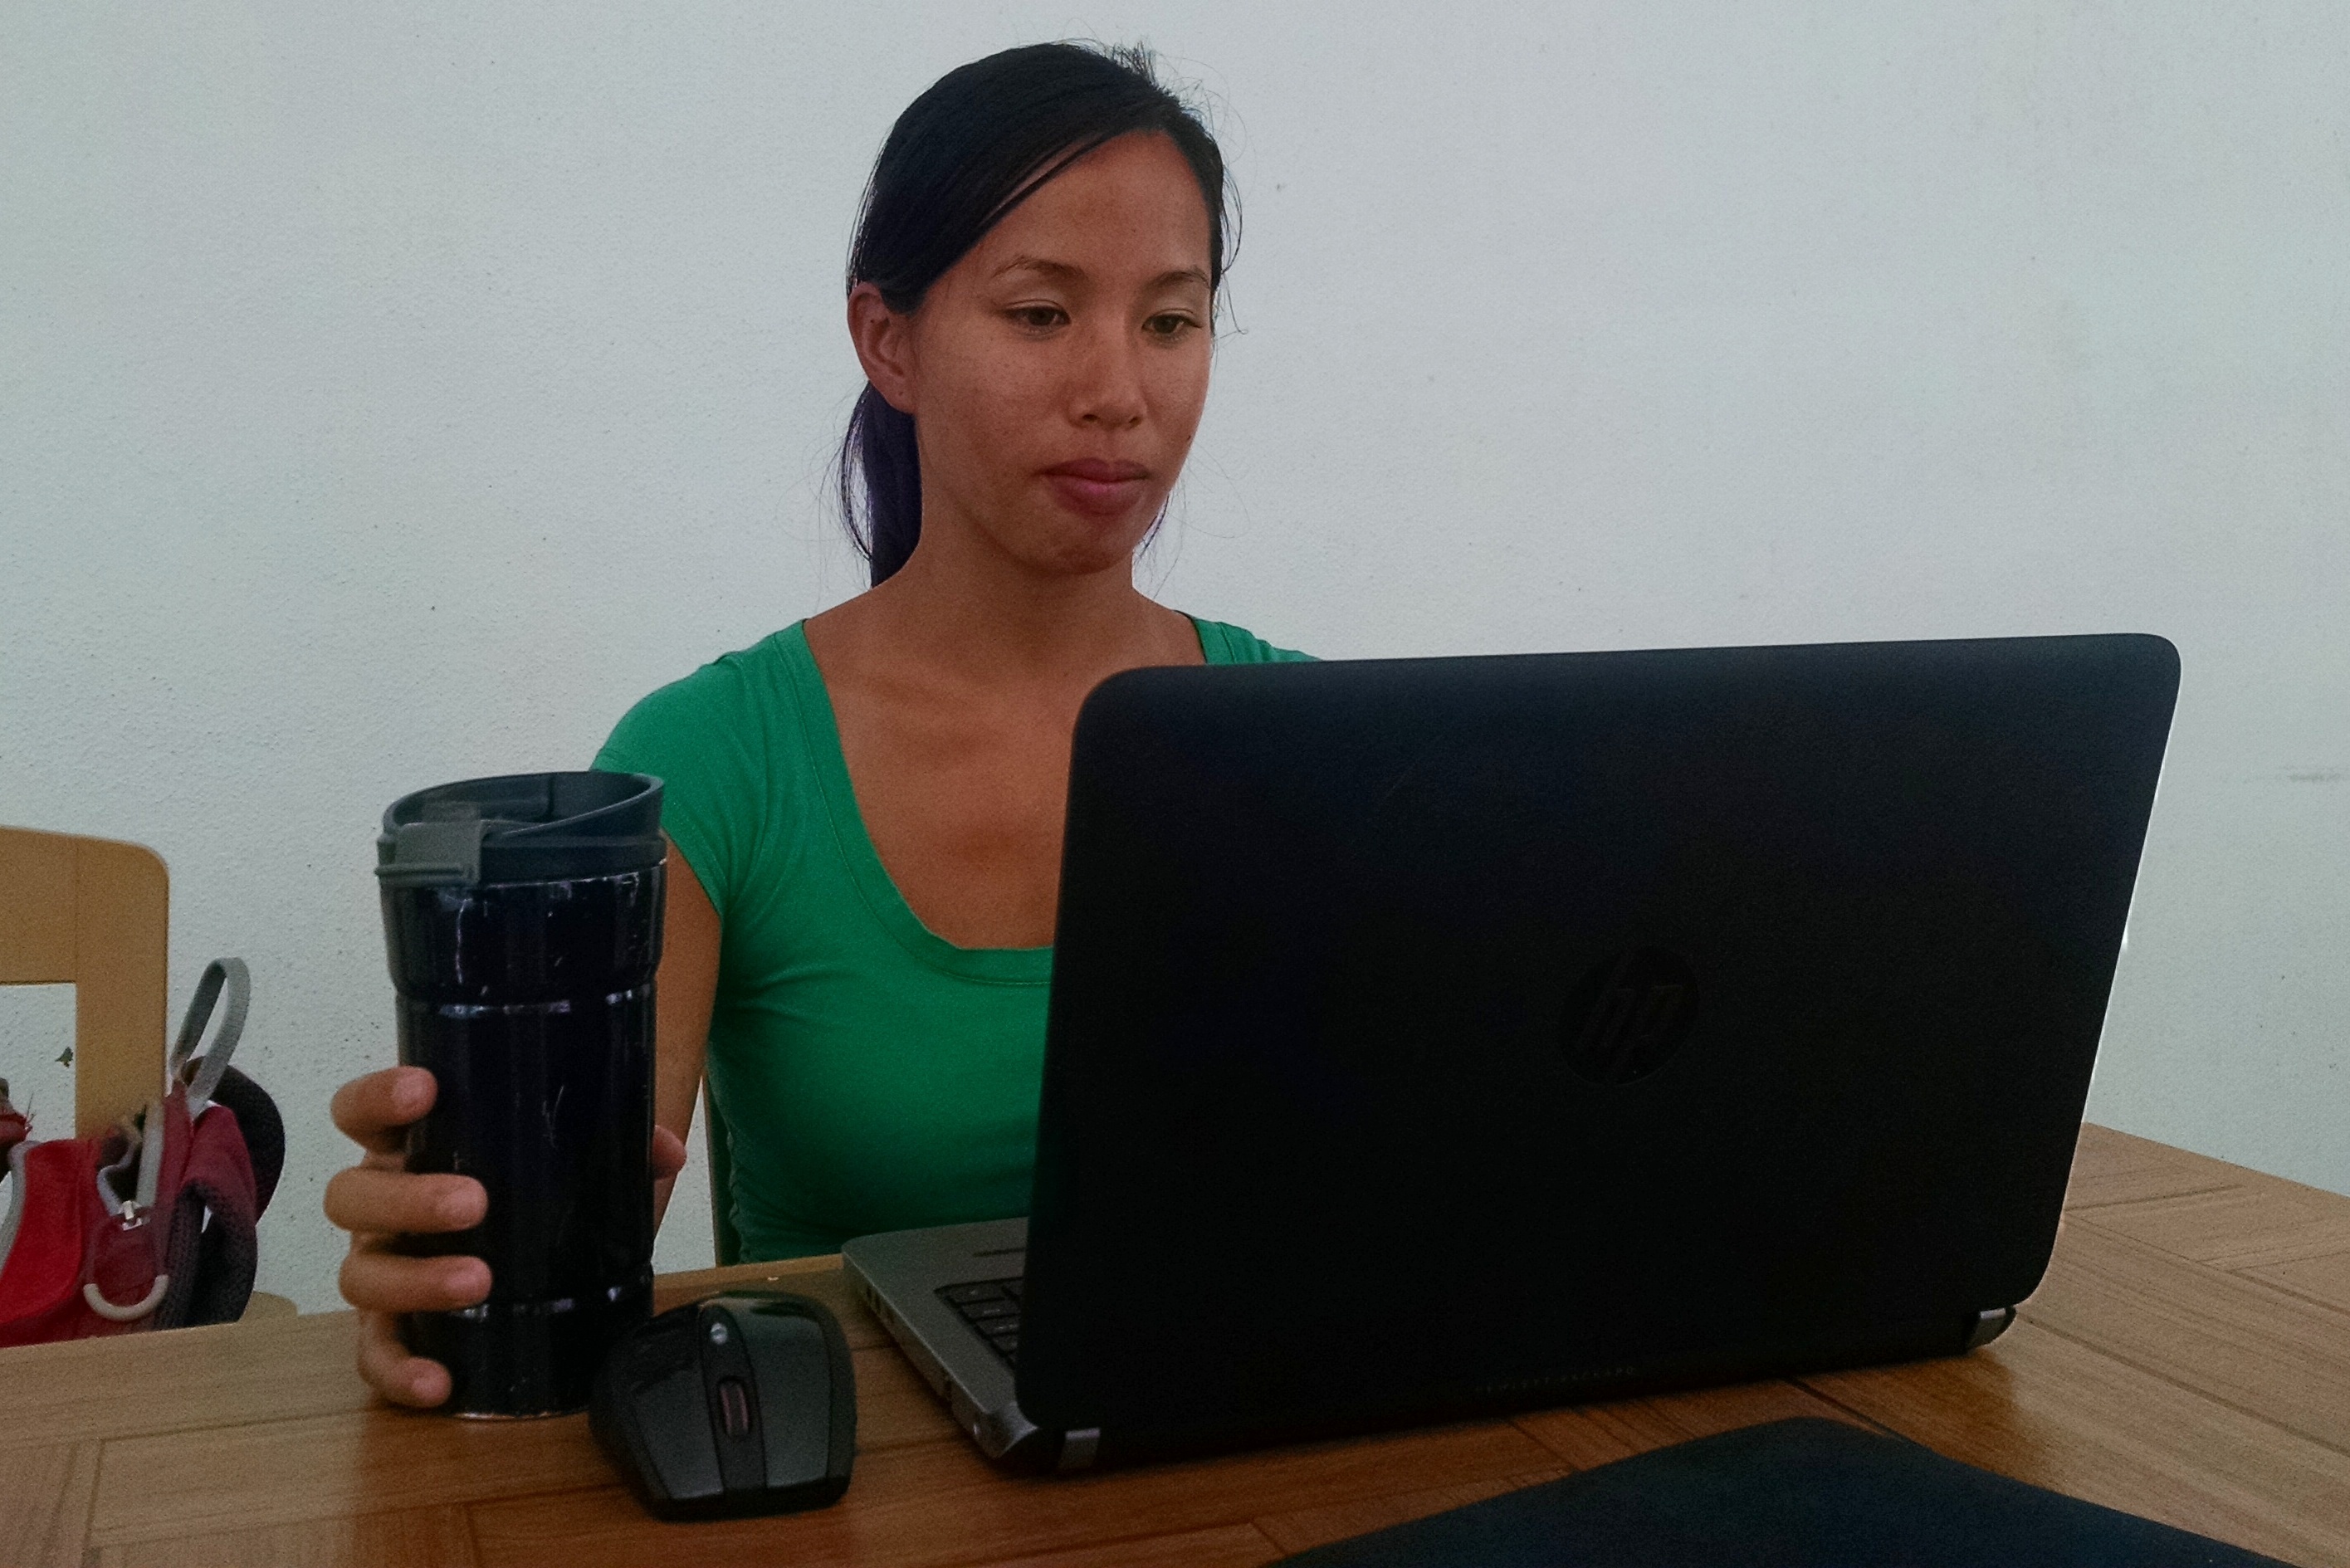
We’ve learnt a lot about doing seabird surveys at-sea. But, what happens after you’ve collected all those data? Maybe this is when the hard work really starts? Catherine Pham (above) explains:
What happens after a research cruise?
Well, we first go stretch our legs by going for a long walk. But after that, we get back to work. We collected a lot of data, and we now need to turn these into something understandable and useful.
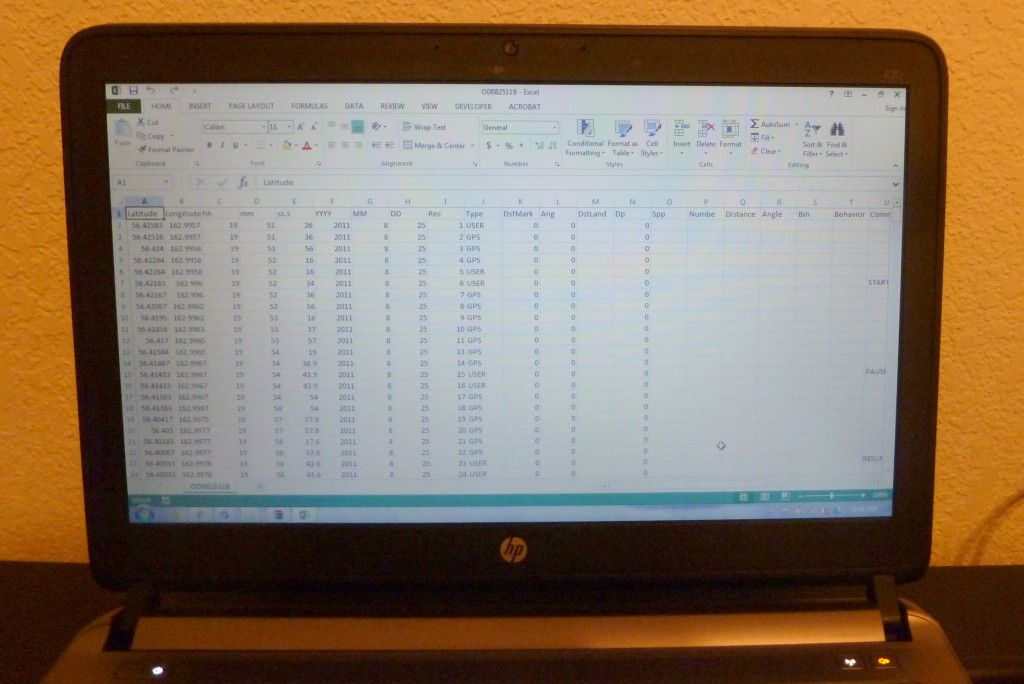
Seabird observers enter their data directly into a laptop while observing. The computer program that we use produces spreadsheets that contain all the information we recorded: latitude and longitude of each sighting; number of birds per sighting; species of birds for each sighting; distance category for each sighting (e.g. estimated 100 m from the boat); and weather and sea conditions. We check the data every day for mistakes while our memory is still fresh. It is much harder to find mistakes weeks later; for example we won’t remember which day we saw one particular rare species.
Once we get back to land, we need to turn all these data into something a little more manageable for mapping and analysis.
Data analysis
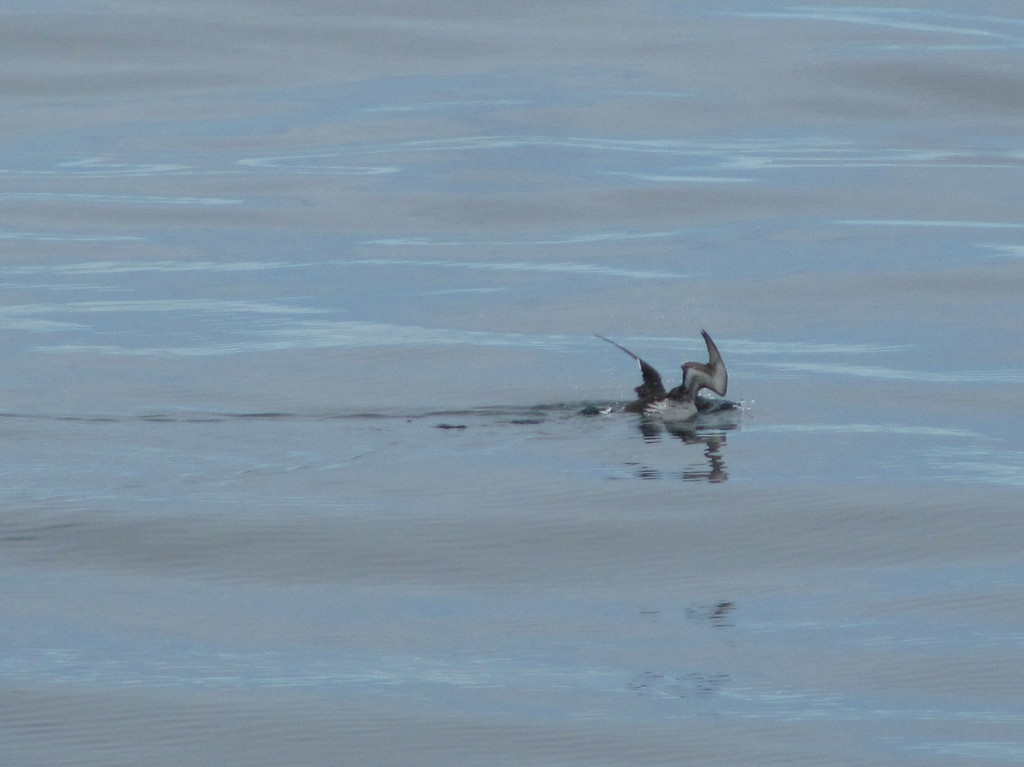
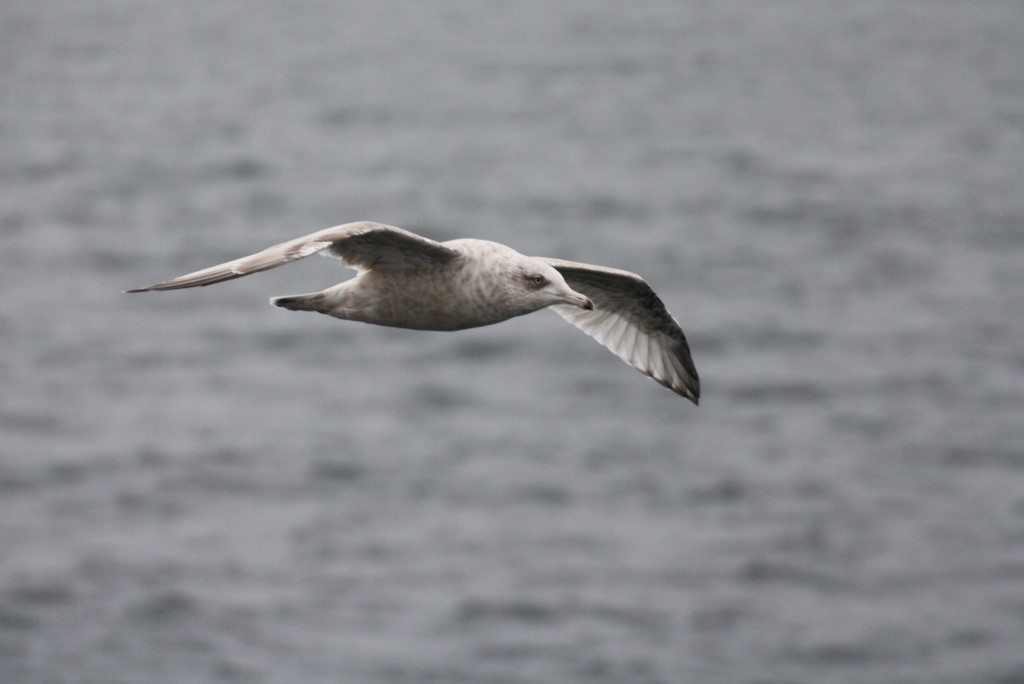
We start off by correcting our seabird counts. What does correcting data mean? We don’t see every bird that’s on our survey transect, and birds react to the ship, so the birds that we do record are not an accurate representation of what birds are actually there when we’re not present. Smaller, darker birds (like auklets) are harder to see than larger, lighter birds (like gulls), and some birds (like fulmars) follow ships while others (like murres) try to avoid them by diving underwater or by flying away. Big seas and foggy weather also affects how well we can see birds. We calculate how the detectability of each species changes with distance from the boat and weather conditions, then write a computer code. This code adjusts the numbers of birds we actually saw to more accurately reflect the numbers of birds actually present on our survey transects.
A Common Murre diving to avoid the ship, photo by Catherine Pham
A very conspicuous Vega Gull following the ship, photo by Catherine Pham
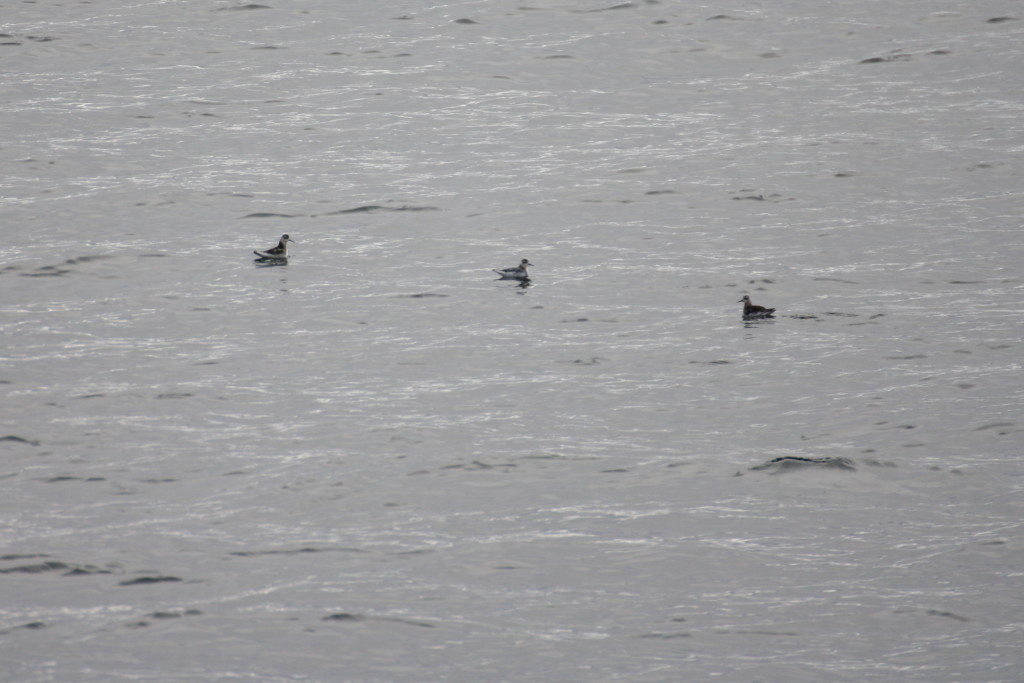
Phalaropes are small and cryptically colored and so they easily blend into the water, photo by Catherine Pham
After we correct the raw data, we then cut up all our survey transects into 3 kilometer long segments, and convert the seabird counts to densities (# birds / km2). These segments of bird densities are then used for analyses.
The analyses we then perform depend on what kind of questions we want to ask.
So what kind of questions can we ask using seabird survey data? Answer: almost anything that concerns seabird distributions, community structure, and habitat use! We often collaborate with other researchers who study topics such as fisheries and plankton to learn how seabirds interact with other ecosystem components.
One of the goals of the Arctic Marine Biodiversity Observing Network (AMBON) is to establish a sustainable model for the long-term monitoring of biodiversity, with the aim of being able to detect and predict changes in the number and distribution of marine species over time.

